
Long, long time ago … I started with Octave and Matlab.They were amazing and allowed me to solve a lot of interesting problems in my research. I loved the command window of Octave, but I needed the productivity an IDE gives when developing complex calculations. None of the available IDE’s for Octave were not as powerful as the Matlab IDE. The problem was that Matlab was not GNU and buying a license was very expensive. Then, I found R and I realized that none Octave neither Matlab were the tool I needed for my research. I needed advanced project and file management through repositories, fast data manipulation, an easy way to export my calculations, a creative way of authoring reports and a powerful IDE that let me access my beloved command window. Now R gives me all I need and is an important part of my everyday toolbox. For those who does not known R, I must say that R is a well known programming language that is widely used on mathematics, economy, biology… Its main benefits includes the ability to work easily with statistics and data manipulation. R is very popular on academics and research, is GNU, very powerful and have a lot of packages that allows do magical things in a few clicks or with a few commands.
Recommended IDE
There are some interesting IDE’s for R (Tinn-r, Rattle, Red-R), but I my opinion, the recommended ones are Eclipse + StatET or RStudio. Both are powerful and you can get them for free. If you also code in java, you may prefer StatET. Every IDE has its pros and cons. In my case, I am using RStudio because I need the integration RStudio offers with others tools I need like Rpubs.
RStudio
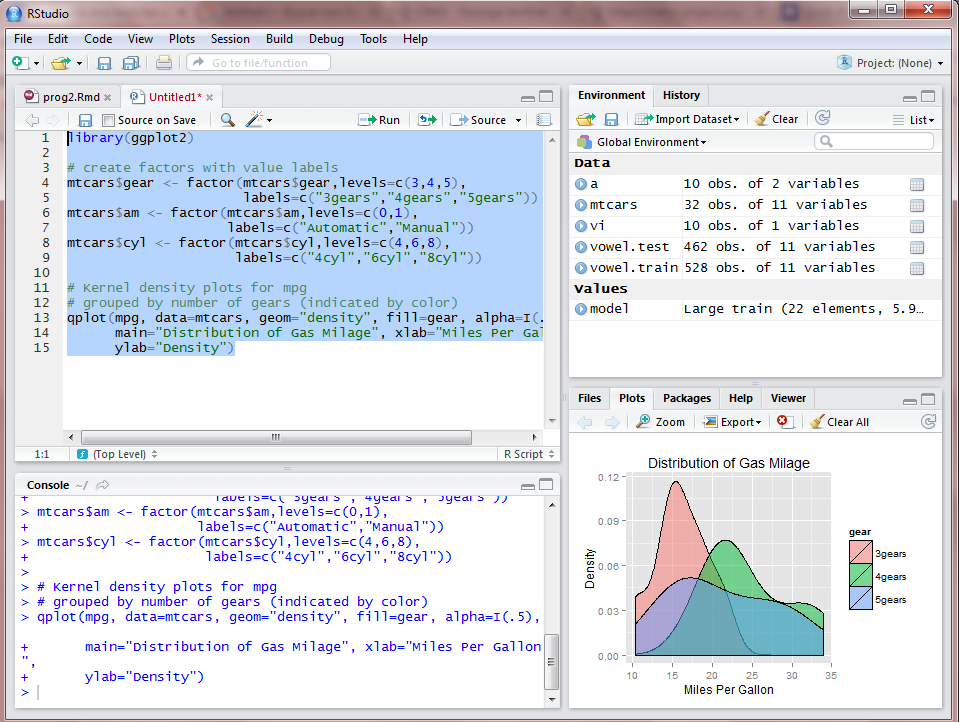
Is the facto the standard IDE when using R. It integrates all the functionalities you may need in an advanced editor: file editor, debugger, environment browser, data import, package manager…RStudio is Open Source and has an important community. if you need extra support, Rstudio also offers supports plans. As you will read in that article, RStudio is an environment that lets you to work with your R files and projects, but it also integrates tools for versioning your code, the creation of the project documentation and the publication of that documentation in the Cloud.

RStudio
Recommended packages for developers
devtools
Also, ‘a must have’ package and perhaps is the most important package you may need. The pùrpose of that package is helping create new packages. You may also need it when loading third party packages like rCharts, using github as code repository or loading data from raw files.
roxigen2
The main benefit of that package is that it helps document your code. If you are familiar with javadoc from Java(r), roxigen2 is the equivalent tool in R and has similar syntax. You may document your code that as follows in order to compose an API.
#' Add together two numbers
 #'
 #' @param x A number
 #' @param y A number
 #' @return The sum of \code{x} and \code{y}
 #' @examples
 #' add(1, 1)
 #' add(10, 1)
 add <-function(x, y) {
   x +y
 }
Running the following command will create an *.Rd file containing the API:
library(devtools)
document()
testtha
There are few testing packages in R as RUnit or testhat. I have been using testthat in my developments. The main benefits of using testhat over RUnit is that code is more readable, is fastest and it easy to test and entire package to get a report. It must be using along devtools and its use is as simply as:
library(testthat)
load_all("pkg")
# or library(pkg) in case your package is
# already built and installed
test_package("pkg")  #test the entire package
#test strings
test_that("str_length is number of characters", {
expect_that(str_length("a"), equals(1))
expect_that(str_length("ab"), equals(2))
expect_that(str_length("abc"), equals(3))
})
Recommended packages for graphics
R have built-in a base package for plot. This base package is simple to use and are not intended for advanced use. Base plotting includes: density pots, bar charts, pie charts… all of them are enough for standard statistics representation but not suitable for advanced statistics as multivariate relationship. A feature that is appreciated is the possibility to save the plot into a image file for later use in reports. For advanced or more complex charting and plotting, the following packages are recommended:
rCharts
This package is intended for creating interactive graphs and plots. In RStudio there is available an the option to publish directly the result into an “html” file and save it into your ‘github’ account.

rCharts package
ggplot2
This graphic library is composed by its own language that allows advanced graphics. ggplot2 includes advanced plotting functions and can be used in conjunction of the base plot functions that can be found on R.
library(ggplot2)
# create factors with value labels
mtcars$gear <- factor(mtcars$gear,levels=c(3,4,5),labels=c("3gears","4gears","5gears"))
mtcars$am <- factor(mtcars$am,levels=c(0,1),
labels=c("Automatic","Manual"))
mtcars$cyl <- factor(mtcars$cyl,levels=c(4,6,8), labels=c("4cyl","6cyl","8cyl"))

# Kernel density plots for mpg
# grouped by number of gears (indicated by color)
qplot(mpg, data=mtcars, geom="density", fill=gear, alpha=I(.5),
main="Distribution of Gas Milage", xlab="Miles Per Gallon",ylab="Density")
ggplot2 graphics package
ggplot2 samples on github
lattice
Improved library graphics library aimed for plotting multivariate relationship.

Lattice graphics package
lattice samples on github
Recommended packages for machine learning
caret
Great package with a lot of functions that will help creating predictive models. Especially useful for: data splitting, pre-processing, feature selection, model tuning using resampling and variable importance estimation. Take a look at this site to look for the full API and samples. In the following sample you will see how simple is the creation of samples for training and tests:
library(mlbench)  #data available in the mlbench package
data(Sonar)
str(Sonar[, 1:10])
library(caret)
set.seed(998)
#creating a radom sample of data for training and tests
inTraining <- createDataPartition(Sonar$Class, p = .75, list = FALSE)
training <- Sonar[ inTraining,]
testing  <- Sonar[-inTraining,]
kernlab
kernlab is an R package providing kernel-based machine learning functionality. It is designed to provide tools for kernel algorithm development but also includes a range of popular machine learning methods for classification, regression, clustering, novelty detection, quantile regression and dimensionality reduction.
dyplr
This is an essential package for data manipulation allowing summarizing, rearranging and joining data sets.
Recomended packages for documentation
R Markdown
R Markdown is an authoring package that allows to create dynamic reports and presentation. On this format, the author combines code and text. The library will compile and create, in real time, the data that should be embedded into the document. Very powerful package that focuses on create quick documents that can be easily modified. RStudio lets you edit, compile, preview and generate that documents.

Rmarkdown package
Rpubs
Rpubs is a nice web site where you can upload and share your own reports or R documents created on RStudio using the R Markdown language. RStudio lets you upload automatically the generated document into the Rpubs website.
Take a look at this sample based on the R Markdown sample. https://rpubs.com/dguerrar/repro_ppr2

Rpubs
Slidify
Awesome tool that converts documents from R Markdown into html slides. it also allows to publish these slides automatically into your account in Rpbus or github.
slidify("index.Rmd")
# replace USER and REPO with your username and reponame
publish(user ="USER", repo ="REPO", host ='github')
Other recommended tools
Shiny and shinyapps.io
Shiny is a package that allows to create interactive webapps that can be deployed into shinyapps.io straightforward from RSutdio or the command line. It allow the use of the available R packages (ggplot2, kernab…) and html widgets in order to create interactive tools. This library and the Paas service are very useful when creating simple applications and access by an internet browser. It is not intended for full load or machine learning applications that need heavy calculations.

shinyapp.io
Bibliography
- RStudio https://www.rstudio.com/
- StatET http://www.walware.de/goto/statet
- Octave https://www.gnu.org/software/octave/
- Roxigen2 https://cran.r-project.org/web/packages/roxygen2/vignettes/roxygen2.html
- testthat https://cran.r-project.org/web/packages/testthat/index.html
- lattice https://cran.r-project.org/web/packages/lattice/index.html
- ggplot2 http://ggplot2.org/
- rCharts http://rcharts.io/
- caret http://caret.r-forge.r-project.org/
- kernlab https://cran.r-project.org/web/packages/kernlab/index.html
- dyplr https://cran.r-project.org/web/packages/dplyr/index.html
- Slidify http://slidify.org/
- Rpubs https://rpubs.com/
- R Markdown http://rmarkdown.rstudio.com/
- Shiny http://shiny.rstudio.com/